


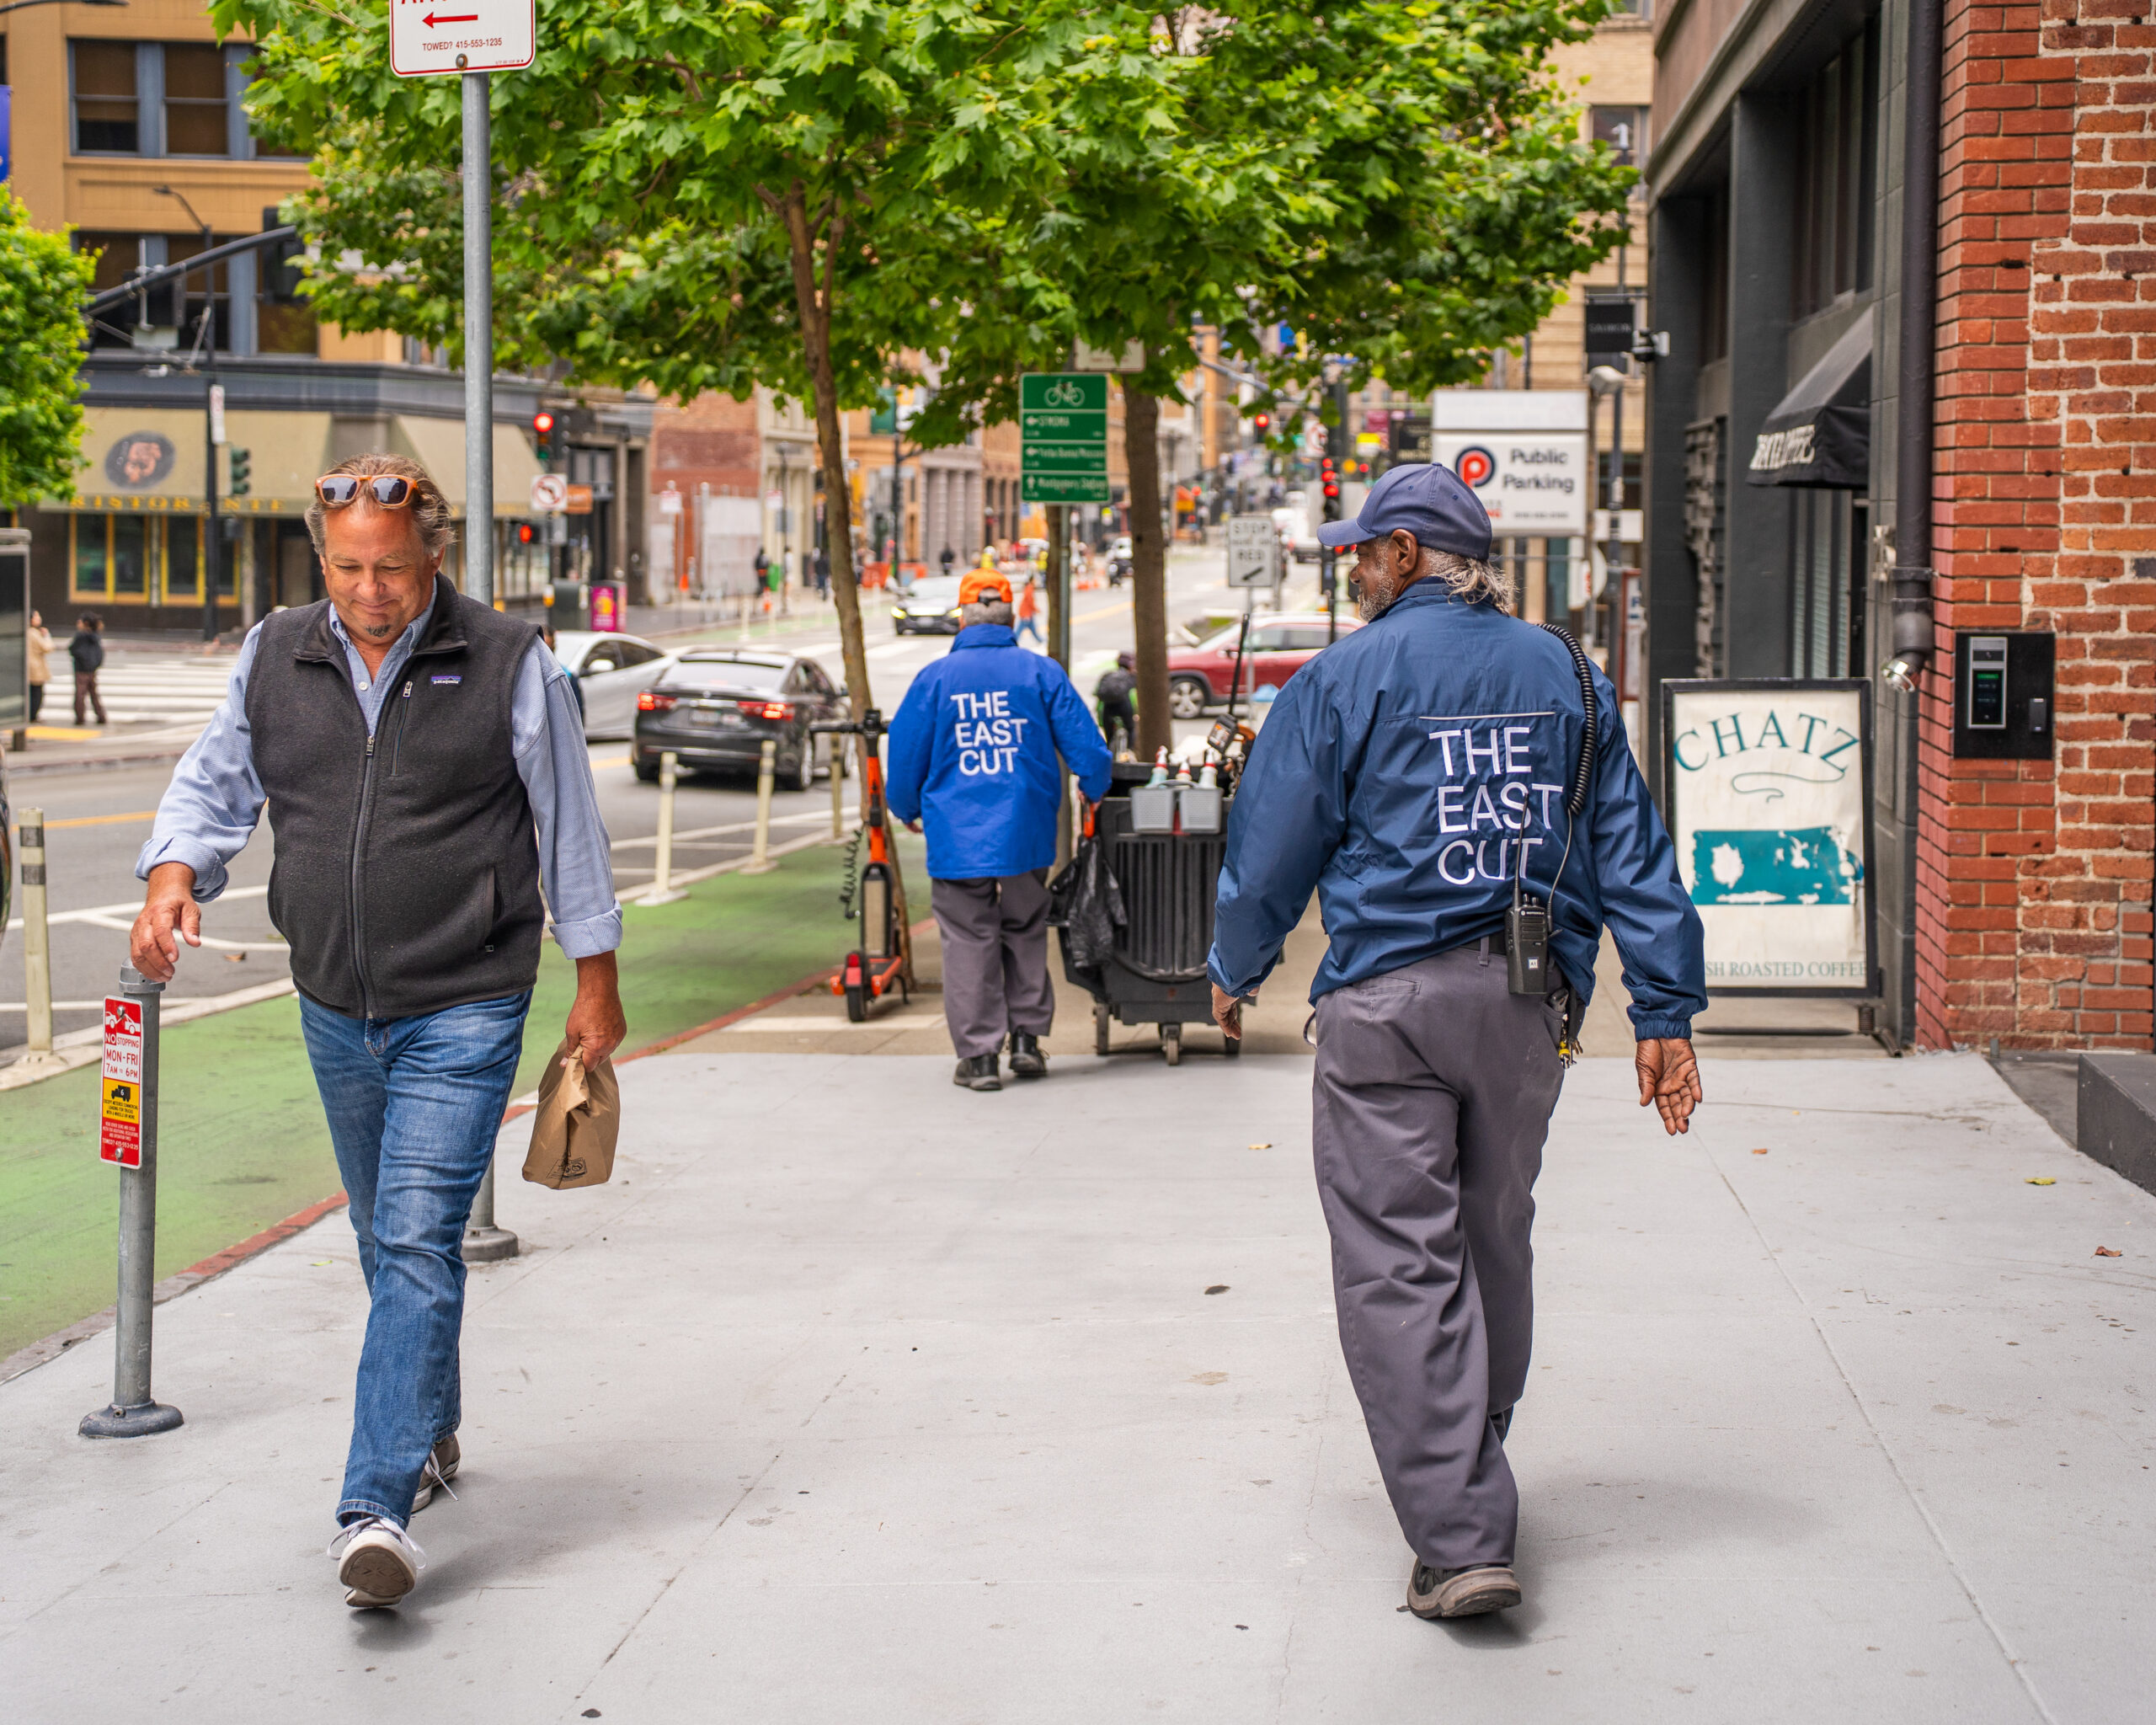
The East Cut Community Benefit District is one of hundreds of 16 property-based assessment districts in San Francisco and more than 1,000 nationwide. The most common funding mechanism for these districts is to levy a special assessment based on the square footage of properties within the district’s boundaries to fund services. These districts are generally located in dense, mixed-use urban neighborhoods that benefit from services above the City’s baseline. Overseen by a board of property owners, residents, nonprofits, and institutional partners, The East Cut CBD delivers these enhanced services while also partnering with City government and advocating on behalf of the neighborhood to ensure its needs are heard and met.
Annual assessments in comparable downtown districts range from 0.18 to 0.25 cents per sq. ft.
(Mobile viewers: swipe right for additional columns) >
| District | Assessment Budget | Appx District Sq. Ft. | $ per sq. ft. |
|---|---|---|---|
| Meatpacking District New York (2026) | $3,636,275 | 7.5M | $0.48 |
| Union Square Alliance – San Francisco (2026) | $7,276,030 | 17.3M | $0.42 |
| Houston Downtown Mgt District (2026) | $19,127,948 | 56.9M | $0.34 |
| Downtown San Diego PBID (2026) | $14,988,112 | 52.3M | $0.29 |
| Alliance for Downtown New York (2024) | $20,400,000 | 82.6M | $0.25 |
| Downtown Seattle MID (2024) | $19,306,000 | 80.7M | $0.24 |
| Downtown Sacramento PBID (2026) | $5,920,809 | 25.2M | $0.23 |
| Downtown San Jose PBID (2025) | $5,002,877 | 21.9M | $0.23 |
| Downtown SF Partnership (2026) | $11,052,168 | 47.4M | $0.22 |
| Downtown Denver BID (2023) | $7,289,000 | 38.4M | $0.19 |
| Downtown Long Beach PBID (2026) | $4,357,482 | 22.7M | $0.19 |
| Downtown DC BID (2025) | $10,654,000 | 58.5M | $0.18 |
| Union Square Partnership NYC (2025) | $4,200,000 | 24M | $0.18 |
| Downtown LA Downtown Center BID (2025) | $8,650,114 | 64.0M | $0.14 |
| The East Cut Community Benefit District (2026) | $5,116,939 | 37.0M | $0.14 |
 How We Stack Up
